GOES-16 Monitors Record Flooding in the Midwest
April 3, 2019
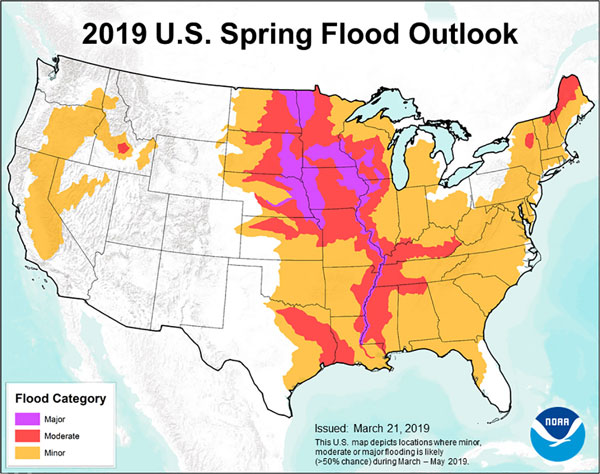
The National Weather Service (NWS) is reporting an accelerated flood season across the Midwestern United States. According to NOAA’s 2019 Spring Outlook, nearly two-thirds of the lower 48 states face an elevated risk for flooding through May, with the potential for major or moderate flooding in 25 states. New flood products utilizing geostationary and polar-orbiting satellite data are helping forecasters better determine where and when flooding will occur.
When a catastrophic storm hits, the resulting floods can be deadly and cost billions of dollars in economic losses. In the U.S., floods are responsible for more loss of life and property than any other severe weather event.
NOAA’s new flood products, developed by algorithm scientists Sanmei Li and Donglian Sun at George Mason University with NOAA support, use data from the NOAA-NASA Suomi NPP and NOAA-20 satellites’ Visible Infrared Imaging Radiometer Suite (VIIRS) instrument and NOAA GOES-R Series Advanced Baseline Imager (ABI). New spectral channels, improved resolution, and faster scanning capabilities (compared to the imager on previous GOES satellites) from ABI allow for better discernment of meteorological features and real-time monitoring of environmental hazards. The maps created using the new flood products, along with aircraft, unmanned drones, and ground assets help determine the impact of a storm – where flooding is happening, what the extent is, as well as how long it will last and what damage has occurred.
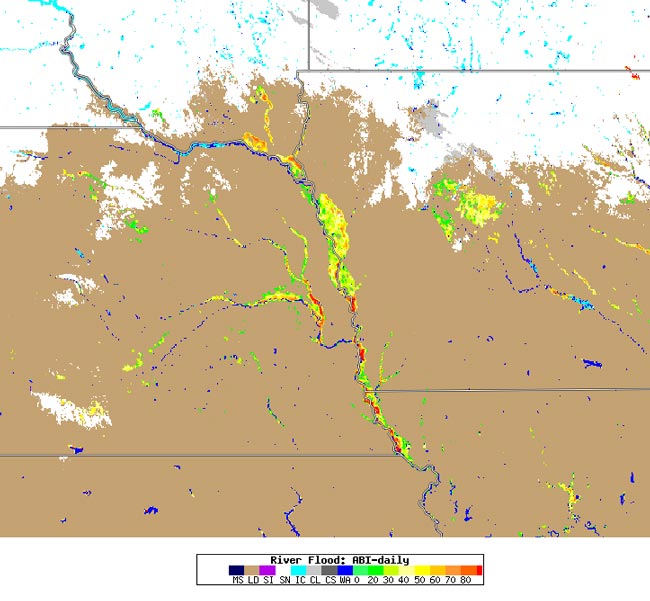
On March 13, 2019, a winter storm system intensified and swept across much of the Central U.S., causing heavy rain, severe thunderstorms, snow, and blizzard conditions. This unusually deep mid-latitude cyclone met the criteria for a “bomb cyclone,” rapid intensification of a cyclone (low-pressure system) with surface pressure falling by at least 24 millibars in 24 hours. The storm led to widespread flooding across parts of South Dakota, Nebraska and Iowa.
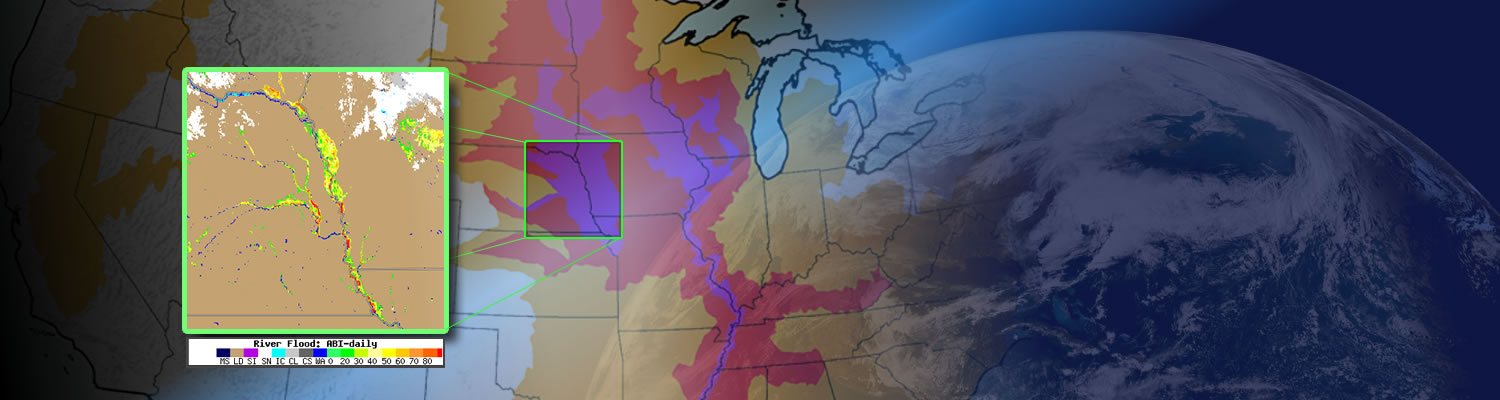
The Missouri Basin River Forecast Center utilized the new flood products during this record flood event. “This definitely shows water out its banks and is another line of evidence of major flooding across the area. It's a nice visual of the whole area, which supports our forecasts going forward,” forecasters stated. “This is game-changing information.” The University of Wisconsin Space Science Engineering Center provides the ABI river flood product hourly as well as an ABI daily river flood product to help forecasters determine where flooding will occur.
These new NOAA flood products help forecast where flooding is likely to occur and aid officials in determining where to employ limited resources during a flood. They also allow for insight into where water is receding. This highly valuable information is given to community officials to help them determine, in combination with other critical resources, when it is safe for people to return to their homes. Improved flood mapping is just one of the many new and enhanced capabilities the GOES-R Series provides for weather and environmental hazard forecasts and warnings and public safety.
Thanks to the Missouri Basin River Forecast Center, Office of Water Prediction’s National Water Center, Cooperative Institute for Meteorological Satellite Studies, Space Science Engineering Center, and Sanmei Li and Donglian Sun at George Mason University for providing information and data for this story.